One month went by! That was fast.
Making sense of things
I am still very much in learning mode but believe I have reached the point where I am forming opinions and viewpoints based on data and things I’ve observed here – instead of things done before elsewhere. So it’s no longer just a transfer of knowledge and former experience but with built-up context, a better-informed assessment.
After sharing this tweet, a few international colleagues responded and expressed how equally tricky it is in their government to have a shared common communication platform.
Stéphanie then articulated the value of a unified communications platform across government:
Making things inclusive
When discussing legacy tech infrastructure that government services are built upon and what those services still need to do to be inclusive, I researched some long strings of actual data that often cannot be processed. Cities and towns might give a new street a long name that cannot even be saved and handled in their own computer systems.
I also stumbled upon a documented talk from another Stéphanie on ‘special characters’, inclusive design and user experience. She demonstrates how systems and services often reject her first name with an acute accent. In her conclusion, she then demands: “stop putting the needs of our systems, database, before the needs of our users”.
As I mentioned a few weeks ago (and my colleague Pamela on LinkedIn), we are looking into accessibility improvements for the DigitalService’s website. I assisted Nadine a bit in prioritising the issues and sorting what can be done by content folks and what needs additional development work.
Meeting users, ideas, and a new designer
Talking about users, I finally spent time in user research sessions, focussing on parts of a flow in the new property tax service to be launched in early July 2022. I’ll do my best to do my 2 hours of user research every 6 weeks at least.
In the Design Weekly session last week, we did an ideation session for potential blog post topics in the design team. This week, we continued prioritising them. Now, I’ve 2 blog posts in the making. 1 of them already has a finished draft.
On the same day, a new starter joined us: Sabrina, who previously worked at Service Innovation Labs and developed serviceblueprint.io.
Working remotely for the second half of the week, I got some FOMO as I missed both the first in-person Creative Bureaucracy Festival and also UX Camp Europe. But plenty of things are happening later in June, including the GovTech Gipfel and CityLAB Berlin summer festival. At both events, I agreed to speak now.
Reflecting on my first month, I noted 3 things I think I am doing or going to do through various pieces of work:
- Making work visible
- Connecting the dots
- Growing design & designers
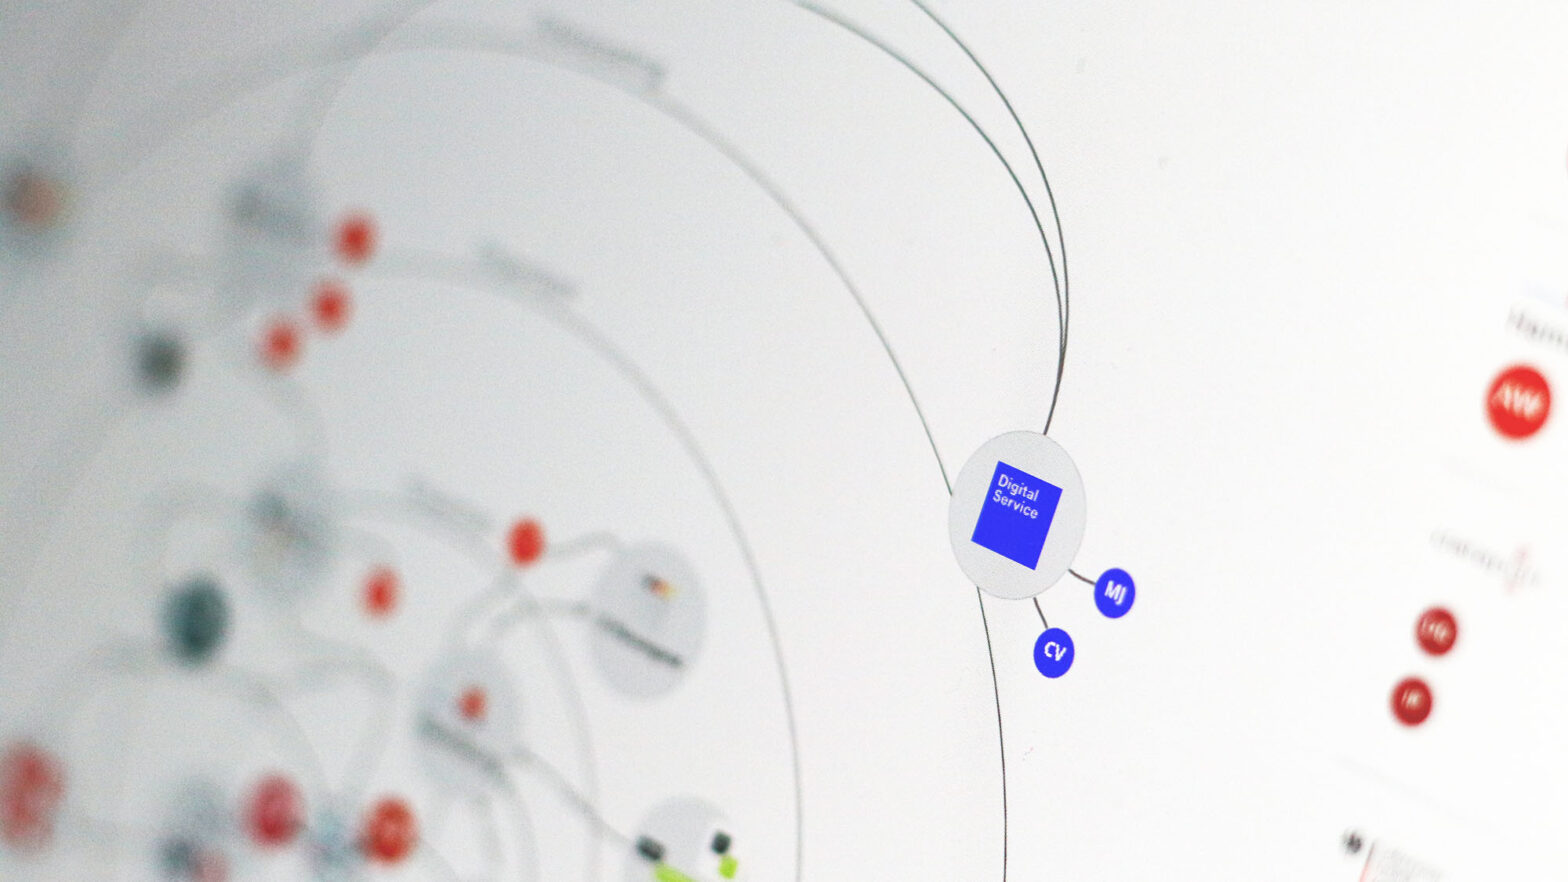
Some connected dots you can see at the very top of this blog post where I started mapping government organisations and some individuals looking into web component libraries and similar things. There is still loads to discover.