Back in October 2025, we ran the 11th edition of our Öffentliches Gestalten meetup series. It was dedicated to the topic ‘Visualising data’. It was a topic I wanted us to cover for a while. I even had the main speaker in mind 3 years earlier. We finally made it happen when schedules and calendars aligned.
Our event description said the following:
The public sector has vast data. Data helps government and the administration drive decisions in policy-making, service development and procedural improvements. Making sense of data often includes making it visual.
At this meet-up, we want to hear stories of data sense-making and explore practical examples of data visualisations. We will hear from multiple speakers and have time for a deeper exchange.”
We managed to edit and publish the recorded talks.
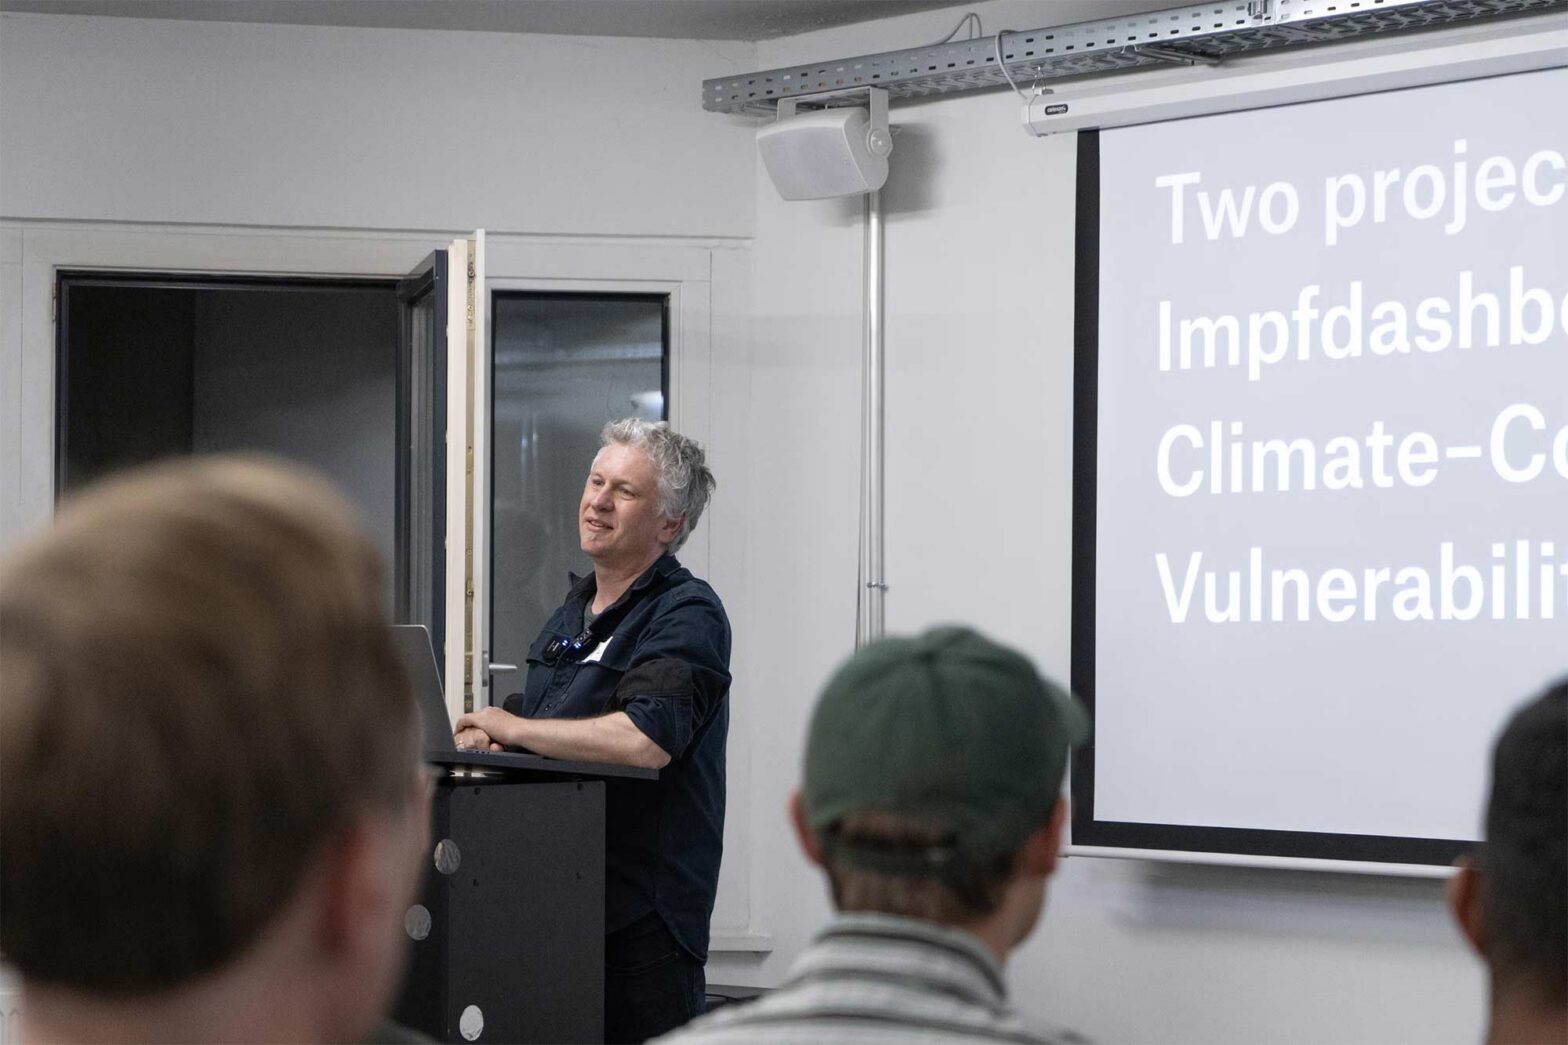
The first speaker was Moritz Stefaner. He calls himself a ‘Truth and Beauty Operator’. He works as an independent designer and consultant for data visualisation.
In his talk, he shared his more recent work for and with the German Federal government. He discusses work on the vaccination dashboard for the Federal Ministry of Health and the climate conflict vulnerability index for the German Foreign Office.
Our second speaker was Ha Thanh Thu Nguyen. She presented her Master’s thesis project ‘Atelierdatasheet’, in which she critically reviews facial recognition technology. Using open-source information, she created a data visualisation using only Google Sheets. She works as a communication manager at CityLAB Berlin.
The evening event was well-attended, and based on 13 reviews, it received a 4.9-star rating on a 5-point scale.